Method
I. Provenances and test site
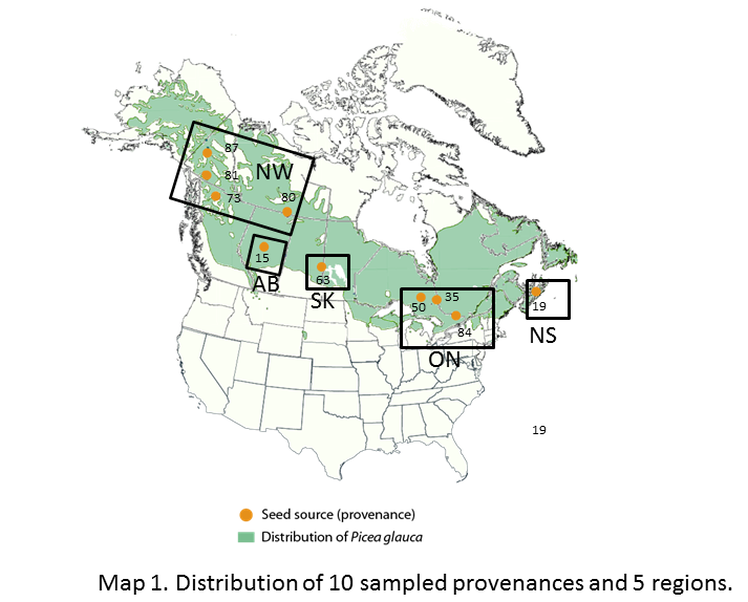
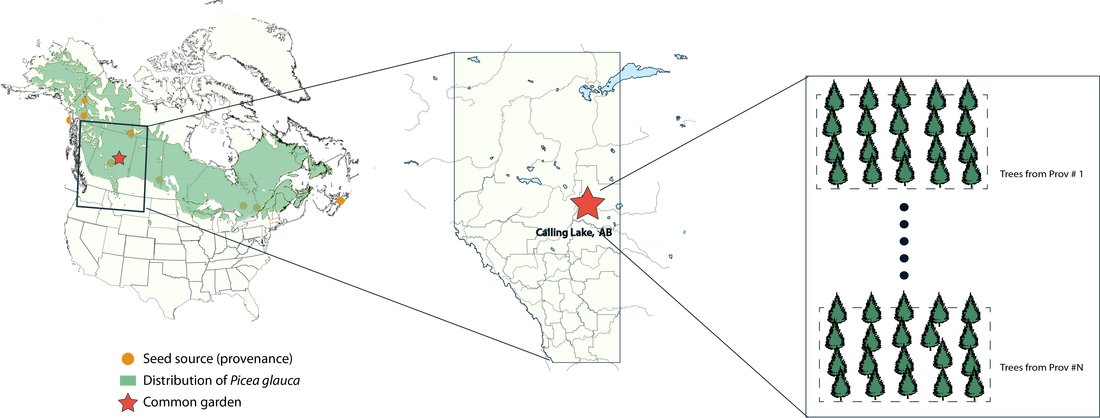
This project is based on the white spruce provenance trials, from which seed material was collected along the widespread distribution of white spruce and planted in Calling Lake, Alberta, CA in 5 blocks. In this project, we randomly chose 10 provenances from them, and try to cover the majority of white spruce distribution range as possible. Information of 10 provenances (#15, #19, #35, # 50, #63, # 73, # 80, #81, #84, and #87) can be found in Table 1. Based on the similarity of their origins, 10 provenances were grouped into 5 regions(Map 1): Northwestern(NW), Alberta(AB), Saskatchewan(SK), Ontario(ON), Nova Scotia(NS).

Information on the climatic conditions at the common garden(Calling lake, Alberta, CA) was obtained from the ClimateWNA v4.62(Hamann et al., 2013) by the Parameter Regression of Independent Slopes Model(PRISM) interpolation method. Since all trees of the provenances trails were planted in 1983, climatic data(mean average temperature(°C)(Tave) and monthly precipitation(mm)(PPT) ) of Calling lake from 1983 to 2013(Table 2) was collected for further correlation analysis.
Since ClimateWNA cannot provide daily climate data for study, we also employed daily climate data of Calling Lake from the Canadian government (http://climate.weather.gc.ca/). The climate data includes daily temperature(maximum, minimum, average) and precipitation(total, as snow, as rain). To define drought years in the common garden, we applied Hargreaves Method to compute daily potential evapotranspiration(PEA) by temperature, calendar days. Then the deviation of PEA and actual precipitation is the amount of moisture deficit. When daily average temperature below -27 °C, PEA would be negative which is senseless. In that case, we assume PEA would be 0 under such low temperature.

II. Tree ring widths measurement
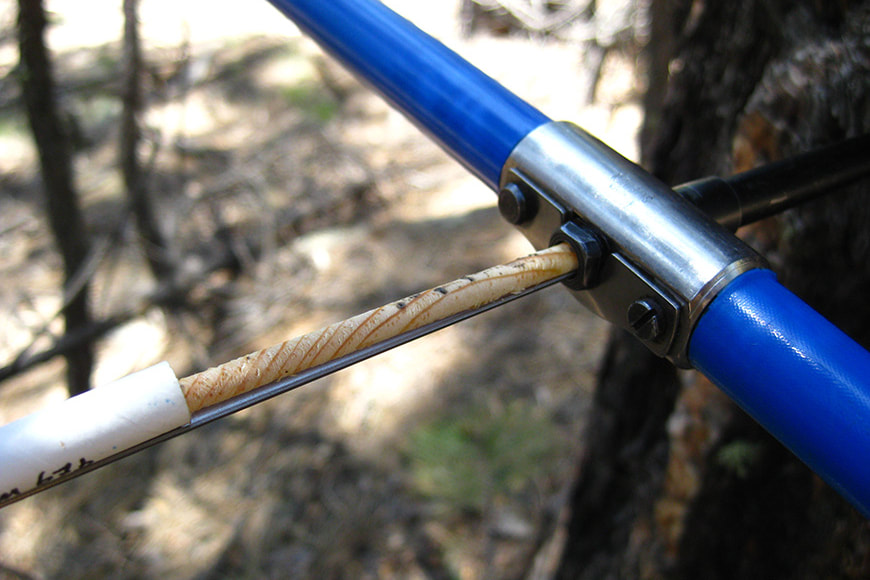
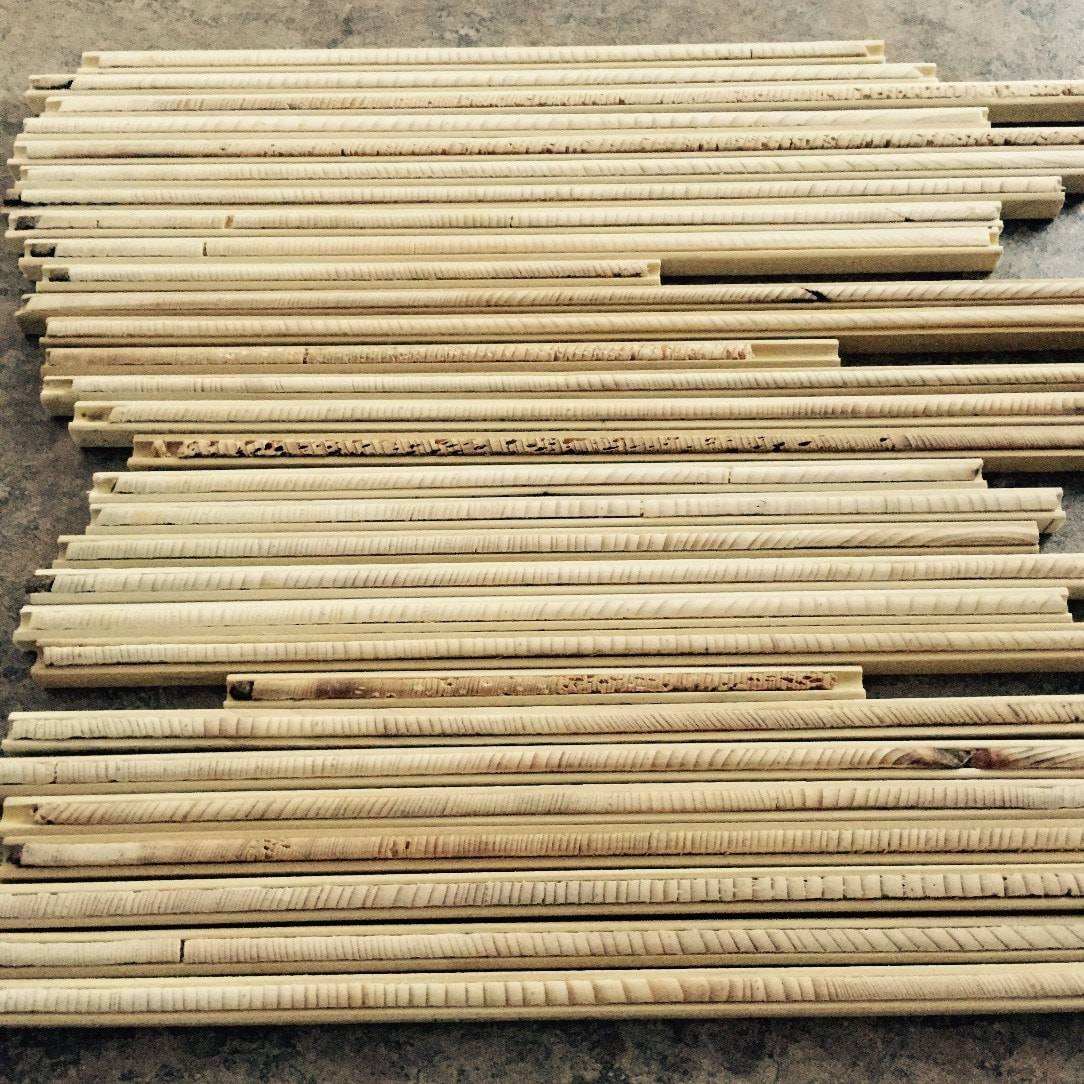
In the common garden, 5 sample trees(1 tree per block) were randomly selected per provenance(50 samples trees in total). Two tree cores per tree was sampled from North and South directions by increment borer(Photo 2) in June 2017, and all core samples(Photo 3) were labels and covered by drinking straws and sent back to the lab for sanding. Digital photos(Photo 4) were token for all sanded cores, and software CooRecoreder version 9.0 (Cybis Elektronik & Data AB, 2017) was used to measure tree ring widths(Photo 5) based on these photos. Tree ring widths for each tree is calculated by the annual arithmetic means of its two wood cores. By tree ring widths and the distances to pith, basal area increment (BAI) can be calculate by dplR package. correlation between tree ring widths and climatic data. all computations were performed by R version 3.4.1 with packages dplR version 1.6.6(Bunn et al., 2012) and pointRes version 1.1.3(van der MaatenTheunissen et al., 2015).

III. Drought tolerant indices
We analyzed individual white spruce resilience to drought-related events using indices for resistance, recovery, and relative resilience(Lloret et al., 2011). Drought tolerant indices is computed by comparing growth during the drought year(Dr) with the average growth before the year(PreDr) and after the year(PostDr). Normally, three year before and after disturbances is preferred, but there were two year between these two disturbances. In this study, we averaged five year before the first disturbance year(1999) as PreDr, and toke five year after the second disturbance(2002) as PostDr. Resistance is calculated as the ratio of the growth at disturbance to before (resistance = Dr/PreDr); recovery is the ratio of the growth after to during the event(recovery = PostDr/Dr); relative-resilience is the ratio of the deviation of after and during disturbances to before the event(relative resilience = (PostDr - Dr)/PreDr).
We analyzed individual white spruce resilience to drought-related events using indices for resistance, recovery, and relative resilience(Lloret et al., 2011). Drought tolerant indices is computed by comparing growth during the drought year(Dr) with the average growth before the year(PreDr) and after the year(PostDr). Normally, three year before and after disturbances is preferred, but there were two year between these two disturbances. In this study, we averaged five year before the first disturbance year(1999) as PreDr, and toke five year after the second disturbance(2002) as PostDr. Resistance is calculated as the ratio of the growth at disturbance to before (resistance = Dr/PreDr); recovery is the ratio of the growth after to during the event(recovery = PostDr/Dr); relative-resilience is the ratio of the deviation of after and during disturbances to before the event(relative resilience = (PostDr - Dr)/PreDr).
IV. Statistical analysis
In this study, 10 provenances are not evenly distributed within 5 regions, which causes the unbalanced design. Therefore, we applied best linear unbiased estimates(BLUEs) of tree height, DBH, BAI, and drought tolerant indices. In the mixed model, I used regions as fixed effects; block, provenances as random effects. To limit the type-I error, the alpha value was corrected by tukey 's adjustment.
To build the transfer function for the single test site, I employed parabolic and Gaussian non-linear regression to model the bell-shape pattern: seeds from too cold or too warm provenances may maladjusted the climate of the test site and have low growth performance; while seed sources close to local are more likely to have good growth. Therefore, I used two regression models to fit the data, and compare them by AIC to pick the better one.
To highlight the response to disturbance, we first standardized ring widths to make all lines have mean = 0, and sd = 1; then, remove a age-trend modeled by smooth spline from each line.
Correlation between tree ring widths and climatic data. all computations were performed by R version 3.4.1 with packages dplR version 1.6.6(Bunn et al., 2012) and pointRes version 1.1.3(van der MaatenTheunissen et al., 2015).
